
Applies to: OpsLogix VMware Management Pack (all versions) · SCOM 2019, 2022, 2025 · vCenter 7.0, 8.0, 9.0
Last updated: October 2026 · Reading time: 3 minutes
The VMware Management Pack has several "Overall Status" monitors. Each one reads the overall status of a VMware object in vCenter and shows the same status in SCOM. For a datastore, you'll find this monitor in Health Explorer under Availability. It runs every 5 minutes, raises an alert when the state changes to Warning or Critical, and closes the alert when the datastore is healthy again. Its state rolls up to the datacenter.
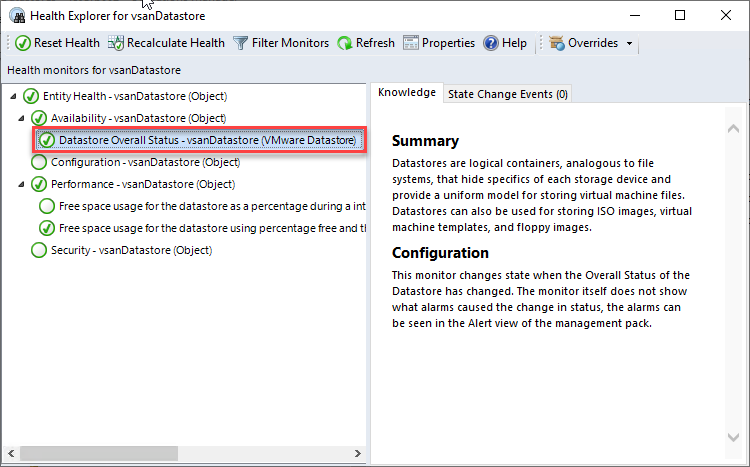
How vCenter status maps to SCOM health
| Datastore status in vCenter | Meaning in vCenter | Monitor state in SCOM |
| Green | The datastore is working normally. | Healthy |
| Gray | The status is unknown, for example because of connectivity issues. | Healthy |
| Yellow (or any other value) | Something needs attention, but it isn't critical yet. | Warning |
| Red | A critical problem that could affect the availability or integrity of stored data. | Critical |
Note: the Overall Status monitors for datacenters, hosts, virtual machines and networks map gray to Healthy in the same way. The monitors for clusters, distributed virtual switches and resource pools only treat green as Healthy, so gray shows as Warning there.
Check a datastore's status in vCenter
To compare SCOM with vCenter, you can look up the datastore's status in the vCenter Managed Object Browser (MOB). The MOB must be enabled on your vCenter server.
- In the SCOM console, open the Detail View of the datastore (in this example, vsanDatastore) and note its object ID.
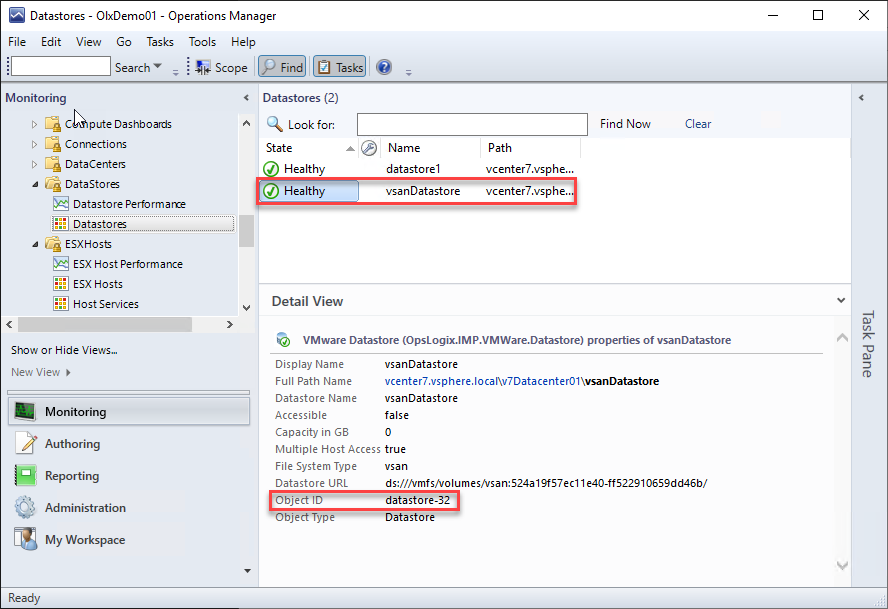
- In a web browser, go to https://<vcenter fqdn>/mob, replacing <vcenter fqdn> with the fully qualified domain name or IP address of your vCenter server.
- Find the datastore object (in this example, datastore-32).
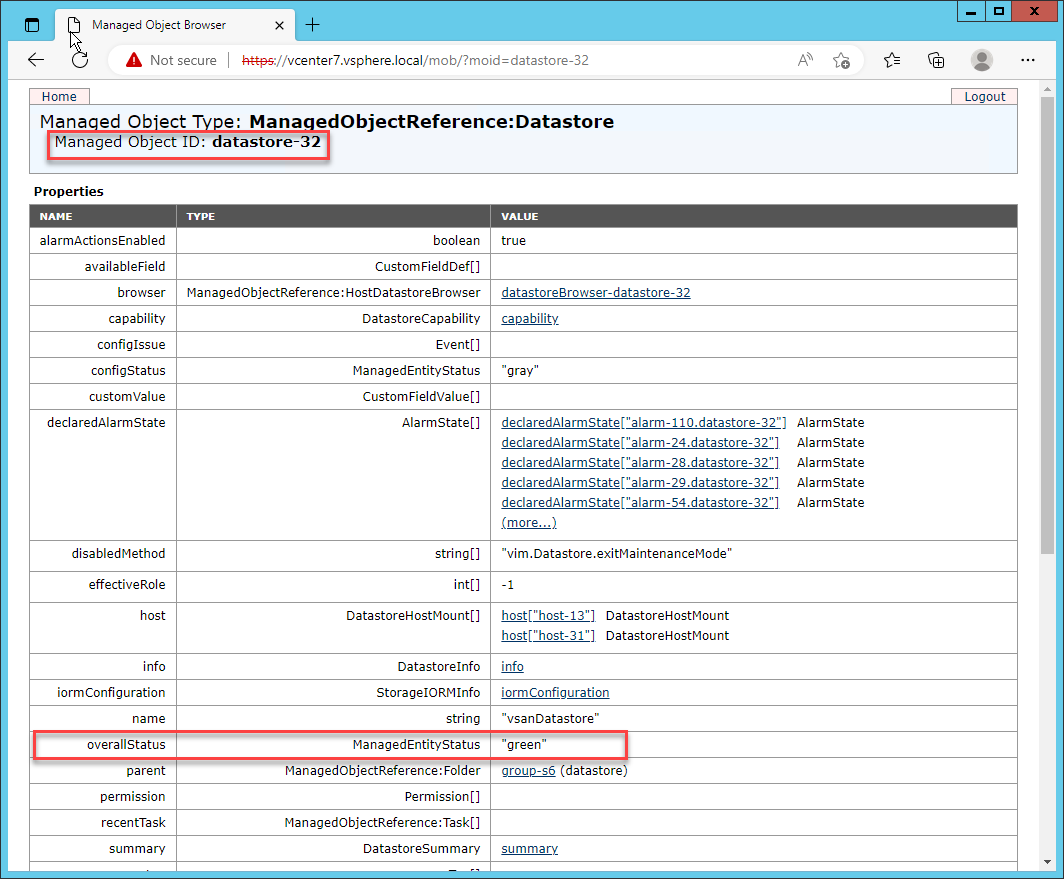
- Check the overallStatus property of the datastore. It shows green, yellow, red or gray, as described in the table above.
See also
- Rules and monitors
- Overcommitment monitors in the VMware Management Pack
- Get the health state of a monitor with PowerShell