Overview
Currently, we have 5 options for debugging your workflows:
- Eventlog
- WFAnalyzer
- Trace by PowerShell
- TraceConfig ETW Tracer
- Microsoft Message Analyzer ** will make a separate post soon **
Eventlog
Trace by looking at HealthService events or log messages that you have put into your PS/VBS probes. However, this doesn’t provide any information on if a condition connection fails or the PB passed, etc.
Look the Operations Manager Eventlog for the following event ids, note there is a lot more id but this ones will give you a first detection:
| ID
|
Description
|
||
| 1103
|
Summary: xxxx rule(s)/monitor(s) failed and got unloaded, 1 of them reached the failure limit that prevents automatic reload. Management group “xxx”. This is summary only event, please see other events with descriptions of unloaded rule(s)/monitor(s).
|
||
| 1102
|
Rule/Monitor “%4” running for instance “%3″ with id:”%2” cannot be initialized and will not be loaded. Management group “%1”
|
||
| 1101
|
Host reference in workflow “%4”, running for instance “%3″ with id:”%2” cannot be resolved. Workflow will not be loaded. Management group “%1”
|
||
| 1206
|
Rule/Monitor “%2”, running for instance “%3″ with id:”%4” failed, got unloaded and reached the failure limit that prevents automatic reload. Management group “%1”.
|
||
| 4510
|
The Health Service encountered an error %5 causing the rule “%2” running for instance “%3″ with id:”%4” in management group “%1”.
|
||
| 5412
|
Converting data batch to XML failed with error “%6” (%5) in rule “%2” running for instance “%3″ with id:”%4” in management group “%1”.%n %n The rule will be unloaded.
|
||
| 5401
|
Failed to replace parameter while creating the alert for monitor state change.
|
WFAnalyzer
This is a tool provided by Microsoft. You will have to copy it from the VSAE installation media to the SCOM server installation directory since it needs some extra DLLs. See for VSAE here: https://www.microsoft.com/en-us/download/details.aspx?id=30169
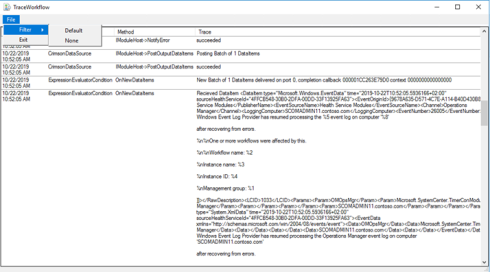
When you start the program you will be asked to apply an MS server and the Agent to trace. After this, you will see a running workflow table. Pick one workflow you want to trace and right-click -> Trace. Now a new trace window will be started with the formatted output of the trace.
I must say that using this tool is a must-have for SCOM MP authors…. If it works … since SCOM 2012 R2 and above most of the time it fails to start a trace.
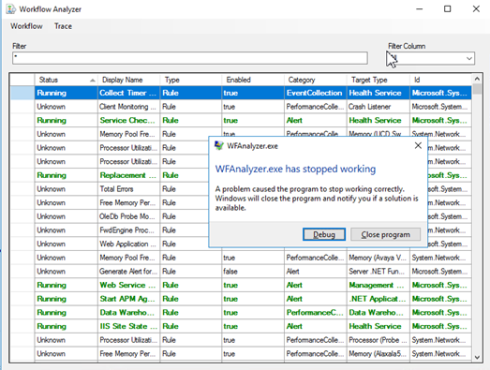
If it crashes you could try to do this:
- Open as administrator a CMD
- Execute : “C:\Program Files\Microsoft System Center 2016\Operations Manager\Server\Tools\StopTracing.cmd”
- Execute: “C:\Program Files\Microsoft System Center 2016\Operations Manager\Server\Tools\StartTracing.cmd”
- Execute : “C:\Program Files\Microsoft System Center 2016\Operations Manager\Server\Tools\StopTracing.cmd”
- Execute: “C:\Program Files\Microsoft System Center 2016\Operations Manager\Server\Tools\FormatTracing.cmd”
This will build new CAB/tmf files in the Tools (all.tmf) and Tools\TMF directory that is used to translate the ETW ids to readable messages.
And with a bit of luck, it works. If it works, also have a look at the filter menu. Changing it to None will give you some more details if a WF fails.
Also, keep in mind that this tool needs an SDK connection to execute the ‘get running workflows’ task and also to get WF/instance information from that task results. This information is used to provide you the UI table so you can select the WF to trace. So can I use it on a normal agent? yes, you can but as stated it needs an SDK connection to an MS server. Why? When you start the WFanalyzer it will show you a box where you provide the SDK MS server and the Agent to debug. With this information, it will trigger the task ‘get running workflows’ on that agent. The results are used to build a WF table. But again this is only for providing you the nice UI. Also, I have rewritten the WFanalyzer UI a long time ago to fix this bugs and requirements as far I remember it was due to an invalid GUID that lets the UI table component crash when it updates the WF running states and also I changed the SDK connection mechanism to make it run on an agent. But due to MSFT copyright, I can’t share it with you, sorry. (If someone from the MSFT SCOM team (Kevin ? ) reads this I am happy to share the issues I have fixed.)
But no worry, in the part below I explain how to do this using PowerShell so you don’t have these issues.
Trace by PowerShell
So If you can’t run the WFanalyzer as above. You could use the PowerShell scripts below.
What it will do:
- Get the Workflow and Instance Id to trace
- Create the TraceEnbled override and import the override MP
- Startup a trace listener
- Format real-time the ETW messages to readable content and filter out some irrelevant strings
- Stop the trace
- Remove the override MP
If you run step 1,2 on an MS server to get the IDs you could use it to start the trace on a GW or Agent too.
Step 5 and 6 you should only run if you are done with tracing.
I have separate scripts for Rule, Monitor and Discovery WF tracing. See below:
Rule tracing
import-module operationsmanager
## monitor and target to debug
$targetName=“Target1”
$ruleName=“OpsLogix.IMP.Rule.Ping.WMIPingCheck”
## create override
$rule=Get-SCOMRule-name $ruleName
$ruleClass=get-scomclass –id $($rule.Target).Id
$ruleTarget=Get-SCOMMonitoringObject –Class
$ruleClass
|
?
{$_.Name –like $targetName}
$ruleoverride=“<Overrides> <RulePropertyOverride ID=””DebugOverrideForRule$($rule.Name)”” Context=””$($ruleClass.Id)”” ContextInstance=””$($ruleTarget.Id)”” Enforced=””false”” Rule=””$($rule.Id)”” Property=””TraceEnabled””> <Value>true</Value> </RulePropertyOverride> </Overrides>”
$RuleMP=$rule.GetManagementPack()
$RuleMP.KeyToken
$mp=@”
<?xml version=”1.0″ encoding=”utf-8″?>
<ManagementPack ContentReadable=”true” SchemaVersion=”2.0″ OriginalSchemaVersion=”1.1″ xmlns:xsd=”http://www.w3.org/2001/XMLSchema” xmlns:xsl=”http://www.w3.org/1999/XSL/Transform”>
<Manifest>
<Identity>
<ID>WorkflowTraceOverrideMP</ID>
<Version>1.0.0.0</Version>
</Identity>
<Name>WorkflowTraceOverrideMP</Name>
<References>
<Reference Alias=”$($RuleMP.Name)”>
<ID>$($RuleMP.Name)</ID>
<Version>$($RuleMP.Version)</Version>
<PublicKeyToken>$($RuleMP.KeyToken)</PublicKeyToken>
</Reference>
</References>
</Manifest>
<Monitoring>
<Overrides>
<RulePropertyOverride ID=”DebugOverrideForRule$($rule.Name)” Context=”$($RuleMP.Name)!$($ruleClass.Name)” ContextInstance=”$($ruleTarget.Id)” Enforced=”false” Rule=”$($RuleMP.Name)!$($rule.Name)” Property=”TraceEnabled”>
<Value>true</Value>
</RulePropertyOverride>
</Overrides>
</Monitoring>
<LanguagePacks>
<LanguagePack ID=”ENU” IsDefault=”false”>
<DisplayStrings>
<DisplayString ElementID=”DebugOverrideForRule$($rule.Name)”>
<Name>Workflow Trace Override used by the WorkflowDebugger</Name>
</DisplayString>
</DisplayStrings>
</LanguagePack>
</LanguagePacks>
</ManagementPack>
“@
$mpfile=“c:\temp\WorkflowTraceOverrideMP.xml”
$mp
| Out-File –Encoding ascii $mpfile
Import-SCOMManagementPack $mpfile
# start trace
&“C:\Program Files\Microsoft System Center 2016\Operations Manager\Server\Tools\TraceLogSM.exe”
–start “CustomWorkflowTrace”
–flag 0xFF
–level 5
–ft 1
–rt –guid “#c85ab4ed-7f0f-42c7-8421-995da9810fdd”
–b 1024
&“C:\Program Files\Microsoft System Center 2016\Operations Manager\Server\Tools\tracefmtsm.exe”
–rt “CustomWorkflowTrace”
–display –nosummary –o “C:\temp\WorkflowTrace.log”
–tmf “C:\Program Files\Microsoft System Center 2016\Operations Manager\Server\Tools\All.tmf”
| select-string –Pattern “ModuleDebug”
–NotMatch
# stop trace
&“C:\Program Files\Microsoft System Center 2016\Operations Manager\Server\Tools\TraceLogSM.exe”
–stop “CustomWorkflowTrace”
# remove MP
Get-SCOMManagementPack –name “WorkflowTraceOverrideMP”
| Remove-SCOMManagementPack
Monitor tracing
import-module operationsmanager
## monitor and target to debug
$targetName=“Target1”
$monitorName=“OpsLogix.IMP.Monitor.Ping.WMIPingCheck”
## create override
$monitor=Get-SCOMMonitor –name $monitorName
$monitorClass=get-scomclass –id $($monitor.Target).Id
$monitorTarget=Get-SCOMMonitoringObject –Class
$monitorClass
|
?
{$_.Name –like $targetName}
$monitoroverride=“<Overrides> <MonitorPropertyOverride ID=””DebugOverrideForMonitor$($monitor.Name)”” Context=””$($monitorClass.Id)”” ContextInstance=””$($monitorTarget.Id)”” Enforced=””false”” Monitor=””$($monitor.Id)”” Property=””TraceEnabled””> <Value>true</Value> </MonitorPropertyOverride> </Overrides>”
$monitoMP=$monitor.GetManagementPack()
$monitoMP.KeyToken
$mp=@”
<?xml version=”1.0″ encoding=”utf-8″?>
<ManagementPack ContentReadable=”true” SchemaVersion=”2.0″ OriginalSchemaVersion=”1.1″ xmlns:xsd=”http://www.w3.org/2001/XMLSchema” xmlns:xsl=”http://www.w3.org/1999/XSL/Transform”>
<Manifest>
<Identity>
<ID>WorkflowTraceOverrideMP</ID>
<Version>1.0.0.0</Version>
</Identity>
<Name>WorkflowTraceOverrideMP</Name>
<References>
<Reference Alias=”$($monitoMP.Name)”>
<ID>$($monitoMP.Name)</ID>
<Version>$($monitoMP.Version)</Version>
<PublicKeyToken>$($monitoMP.KeyToken)</PublicKeyToken>
</Reference>
</References>
</Manifest>
<Monitoring>
<Overrides>
<MonitorPropertyOverride ID=”DebugOverrideForMonitor$($monitor.Name)” Context=”$($monitoMP.Name)!$($monitorClass.Name)” ContextInstance=”$($monitorTarget.Id)” Enforced=”false” Monitor=”$($monitoMP.Name)!$($monitor.Name)” Property=”TraceEnabled”>
<Value>true</Value>
</MonitorPropertyOverride>
</Overrides>
</Monitoring>
<LanguagePacks>
<LanguagePack ID=”ENU” IsDefault=”false”>
<DisplayStrings>
<DisplayString ElementID=”DebugOverrideForMonitor$($monitor.Name)”>
<Name>Workflow Trace Override used by the WorkflowDebugger</Name>
</DisplayString>
</DisplayStrings>
</LanguagePack>
</LanguagePacks>
</ManagementPack>
“@
$mpfile=“c:\temp\WorkflowTraceOverrideMP.xml”
$mp
| Out-File –Encoding ascii $mpfile
Import-SCOMManagementPack $mpfile
# start trace
&“C:\Program Files\Microsoft System Center 2016\Operations Manager\Server\Tools\TraceLogSM.exe”
–start “CustomWorkflowTrace”
–flag 0xFF
–level 5
–ft 1
–rt –guid “#c85ab4ed-7f0f-42c7-8421-995da9810fdd”
–b 1024
&“C:\Program Files\Microsoft System Center 2016\Operations Manager\Server\Tools\tracefmtsm.exe”
–rt “CustomWorkflowTrace”
–display –nosummary –o “C:\temp\WorkflowTrace.log”
–tmf “C:\Program Files\Microsoft System Center 2016\Operations Manager\Server\Tools\All.tmf”
| select-string –Pattern “ModuleDebug”
–NotMatch
# stop trace
&“C:\Program Files\Microsoft System Center 2016\Operations Manager\Server\Tools\TraceLogSM.exe”
–stop “CustomWorkflowTrace”
# remove MP
Get-SCOMManagementPack –name “WorkflowTraceOverrideMP”
| Remove-SCOMManagementPack
Discovery tracing
import-module operationsmanager
## monitor and target to debug
$targetName=“Vcenter01”
$discoveryName=“OpsLogix.IMP.VMWare.Discovery.Datacenter”
## create override
$discovery=Get-SCOMDiscovery –name $discoveryName
$discoveryClass=get-scomclass –id $($discovery.Target).Id
$discoveryTarget=Get-SCOMMonitoringObject –Class
$discoveryClass
|
?
{$_.Name –like $targetName}
$discoveryMP=$discovery.GetManagementPack()
$mp=@”
<?xml version=”1.0″ encoding=”utf-8″?>
<ManagementPack ContentReadable=”true” SchemaVersion=”2.0″ OriginalSchemaVersion=”1.1″ xmlns:xsd=”http://www.w3.org/2001/XMLSchema” xmlns:xsl=”http://www.w3.org/1999/XSL/Transform”>
<Manifest>
<Identity>
<ID>WorkflowTraceOverrideMP</ID>
<Version>1.0.0.0</Version>
</Identity>
<Name>WorkflowTraceOverrideMP</Name>
<References>
<Reference Alias=”$($discoveryMP.Name)”>
<ID>$($discoveryMP.Name)</ID>
<Version>$($discoveryMP.Version)</Version>
<PublicKeyToken>$($discoveryMP.KeyToken)</PublicKeyToken>
</Reference>
</References>
</Manifest>
<Monitoring>
<Overrides>
<DiscoveryPropertyOverride ID=”DebugOverrideForDiscovery$($discovery.Name)” Context=”$($discoveryMP.Name)!$($discoveryClass.Name)” ContextInstance=”$($discoveryTarget.Id)” Enforced=”false” Discovery=”$($discoveryMP.Name)!$($discovery.Name)” Property=”TraceEnabled”>
<Value>true</Value>
</DiscoveryPropertyOverride>
</Overrides>
</Monitoring>
<LanguagePacks>
<LanguagePack ID=”ENU” IsDefault=”false”>
<DisplayStrings>
<DisplayString ElementID=”DebugOverrideForDiscovery$($discovery.Name)”>
<Name>Workflow Trace Override used by the WorkflowDebugger</Name>
</DisplayString>
</DisplayStrings>
</LanguagePack>
</LanguagePacks>
</ManagementPack>
“@
md c:\temp –Force
$mpfile=“c:\temp\WorkflowTraceOverrideMP.xml”
$mp
| Out-File –Encoding ascii $mpfile
Import-SCOMManagementPack $mpfile
# start trace
&“C:\Program Files\Microsoft System Center 2016\Operations Manager\Server\Tools\TraceLogSM.exe”
–start “CustomWorkflowTrace”
–flag 0xFF
–level 6
–ft 1
–rt –guid “#c85ab4ed-7f0f-42c7-8421-995da9810fdd”
–b 1024
&“C:\Program Files\Microsoft System Center 2016\Operations Manager\Server\Tools\tracefmtsm.exe”
–rt “CustomWorkflowTrace”
–display –nosummary –o “C:\temp\WorkflowTrace.log”
–tmf “C:\Program Files\Microsoft System Center 2016\Operations Manager\Server\Tools\All.tmf”
| select-string –Pattern “ModuleDebug”
–NotMatch # | Select-Object Line | Out-StringNoWrap
# stop trace
&“C:\Program Files\Microsoft System Center 2016\Operations Manager\Server\Tools\TraceLogSM.exe”
–stop “CustomWorkflowTrace”
# remove MP
Get-SCOMManagementPack –name “WorkflowTraceOverrideMP”
| Remove-SCOMManagementPack
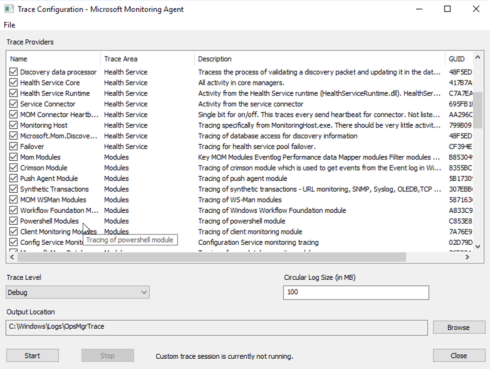
TraceConfig ETW Tracer
So if nothing above did help you get a clue why your workflows are not working you a doomed to use the ETW tracer and go through tons of log lines….
For example, you used 3 state monitor moduletype but specified only 2 state in the monitor…
To trace what is happening follow the steps below:
- Start a OpsMgrtrace using C:\Program Files\ Microsoft System Center 2016\Operations Manager\Server\Tools\TraceConfig.exe
- Select all trace providers from Trace Area: Healthservice and Modules
- Set the trace level to DEBUG
- Start the tracing
- After restarting the SCOM agent wait till you get the 1102 error
- Now stop the Trace
- Format the trace file to a log file . Use as Admin CMD and execute C:\Program Files\ Microsoft System Center 2016\Operations Manager\Server\Tools\FormatTracing.cmd
- Open the log file at : C:\Windows\Logs\OpsMgrTrace\OpsMgrCustom.log (tip VsCode is excellent for this)
- Look for the workflow name or
- Look for text : [ConfigurationManager] [] [Error] :CMonitoringResolver
For example:
[1]11632.15896::09/28/2017-14:45:27.661 [Common] [] [Error] :Common::ParameterReplacement::ReplaceCommon{ParameterReplacement_cpp615}`hr` failed, returning ERROR: {hr= 0x8000ffff(E_UNEXPECTED)}
[1]11632.15896::09/28/2017-14:45:27.661 [ConfigurationManager] [] [Error] :CMonitoringResolver::ResolveOperationalStates{MEMonitoringResolver_cpp1022}Common::ParameterReplacement::Replace failed with code 0x8000ffff(E_UNEXPECTED).
[1]11632.15896::09/28/2017-14:45:27.661 [ConfigurationManager] [] [Error] :CMonitoringResolver::ResolveOperationalStates{MEMonitoringResolver_cpp960}ResolveOperationalState failed with code -2147418113(E_UNEXPECTED).
[1]11632.15896::09/28/2017-14:45:27.661 [ConfigurationManager] [] [Error] :CMonitoringResolver::ResolveMonitorModules{MEMonitoringResolver_cpp425}ResolveOperationalStates failed with code -2147418113(E_UNEXPECTED).
[1]11632.15896::09/28/2017-14:45:27.661 [ConfigurationManager] [] [Error] :CWorkflowsLoader::LoadUnitMonitor{MEWorkflowsLoader_cpp2877}ResolveMonitorModules for ‘OpsLogix.IMP.Oracle.Backup.ARCHIVELOG.Monitor’ failed with code -2147418113(E_UNEXPECTED).
[1]11632.15896::09/28/2017-14:45:27.661 [ConfigurationManager] [] [Error] :CWorkflowsLoader::LoadUnitMonitor{MEWorkflowsLoader_cpp2877}ResolveMonitorModules for ‘OpsLogix.IMP.Oracle.Backup.ARCHIVELOG.Monitor’ failed with code -2147418113(E_UNEXPECTED).
[0]11632.15896::09/28/2017-14:45:15.632 [HealthServiceCommon] [] [Error] :EventLogUtil::LogEvent{EventLogUtil_cpp379}Logging event 1102 from source “HealthService” with severity Error and description “Rule/Monitor “OpsLogix.IMP.Oracle.Backup.ARCHIVELOG.Monitor” running for instance “Backup state for DB11G07″ with id:”{7F1A7474-5A4F-6856-32D7-7FAA6022EC73}” cannot be initialized and will not be loaded. Management group “OM2012SP1Grp01″”.
Solution found to fix this :
Check the <operationalStates> it should match the 2 or 3 states defined the monitormoduletype.
For example the error above missed the Warning state.
<OperationalStates>
<OperationalState ID=”UIGeneratedOpStateIda836de3b0d3645dca0ecdc3b6374c3e4″ MonitorTypeStateID=”Healthy” HealthState=”Success” />
<OperationalState ID=”UIGeneratedOpStateIdaaa73a3abd5144eaa6bff6d72e1d3aaa” MonitorTypeStateID=”Warning” HealthState=”Warning” />
<OperationalState ID=”UIGeneratedOpStateIdc415176391694409926e21afb666c532″ MonitorTypeStateID=”Critical” HealthState=”Error” />
</OperationalStates>
The End
So hope this helps you getting to know why a workflow is not running OR what data a workflow is passing in a PropertyBag.
When I have some time left (and that’s spare) I will finish my post on using Microsoft Message Analyzer for SCOM WF tracing.
Michel Kamp
https://michelkamp.wordpress.com/2019/10/22/debugging-scom-workflows-using-powershell/