Before using the VMware Management Pack, ensure you have followed the steps as
explained in the “OpsLogix VMware Management Pack Installation Guide”.
Please read the license agreement carefully before proceeding.
Prerequisites
You must have installed the VMware Management Pack as explained in the OpsLogix VMware
Management Pack Installation Guide.
Management Pack Guides
The VMware Management Pack incorporates the most common health state of the
components and performance metrics that are important to a VMware environment.
Although, at times you may require to monitor your vSphere custom alerts. With this in mind,
the VMware Management Pack contains templates that allow you to add custom monitors
and rules in order to monitor your VMware environment.
In the VMware Management Pack, you can use the following template:
- VMware Alert Rule – This template allows users to create a rule to check the
environment and then notify the user of the “Active Alert” view in SCOM if the custom
alarm in your vSphere client is raised.
Using the VMware Alert Rule Template
Build your template by following the steps below.
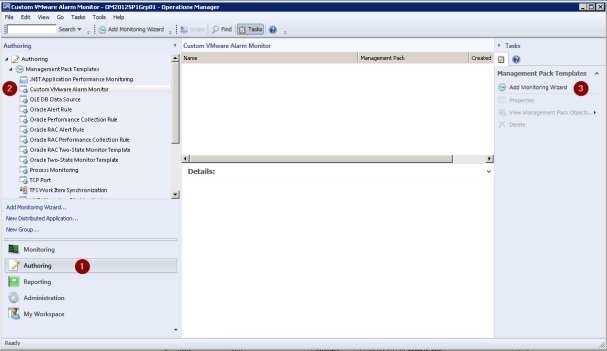
- Navigate to the Authoring section of the SCOM Console in the bottom left panel
- Expand the “Management Pack Templates” object and select “Custom VMware Alarm Monitor
- Click “Add Monitorning Wizard” on the right hand side panel.
Once this is done, the Monitoring Wizard should appear as per the screenshot below.
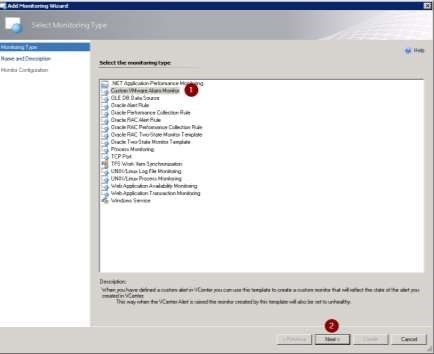
- Select the monitoring type as “Custom VMware Alarm Monitor” 2. Click the “Next” button on the bottom right hand side to proceed.
Now you can start to create the Custom VMware Alarm Monitor.
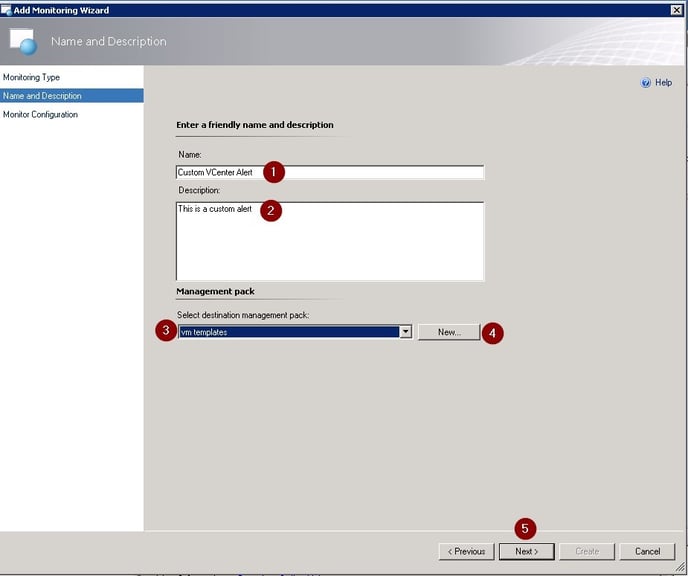
- Fill in the Name section with your custom name (this will be the name of the template monitor in SCOM, see screenshot in the next steps)
- Fill in the description (optional) explaining what this template will monitor
- Select a destination Management Pack (that you have already imported into SCOM)
- Or click “New” to create your own new Management Pack (if you have not imported any)
- Click the “Next” button on the bottom right hand side to proceed.
Now we are in the third and final stage of the custom wizard. Here you will configure the settings of the “Custom VMware Alarm Monitor”.
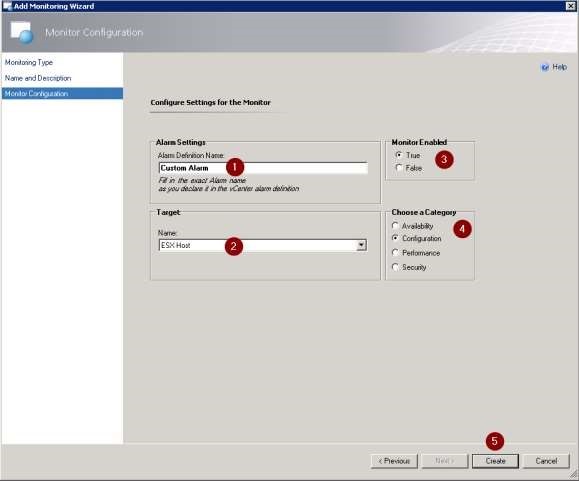
- Fill in the Alarm Definition Name with your existing custom alarm name. The name must be the same as the vCenter alarm definition (see screenshot in the next steps)
- Choose your target object for the alarm
- Select whether the monitor should be enabled when you create it (the default is set to true)
- Choose the category where the custom monitor will appear in the Health Explorer
- Click the “Create” button on the bottom right hand side to create your “Custom VMware Alarm Monitor”.
As mentioned before, these are the alarms in the vSphere Client.
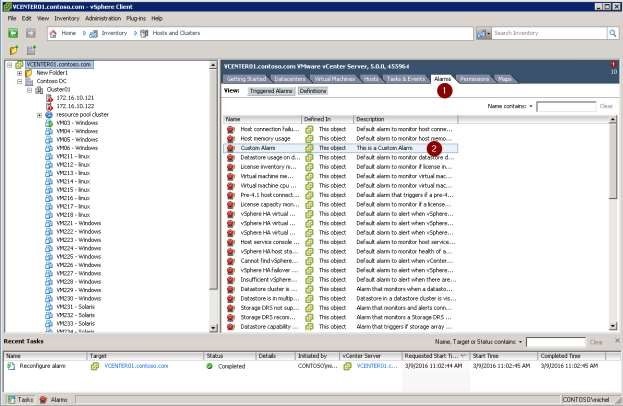
- Select the vCenter object at the top-left hand side (Note: the set alarms are only available if you connect your vSphere client to a vCenter. You cannot view the alarms if you are connected to a single Esx(i)host directly). Then click on the “Alarms” tab
- The “Custom Alarm” created is called the exact same name as in the custom template in the screenshot above.
After you have created the monitor, you can find it under “Custom VMware Alarm Monitor” in the “Authoring section”.
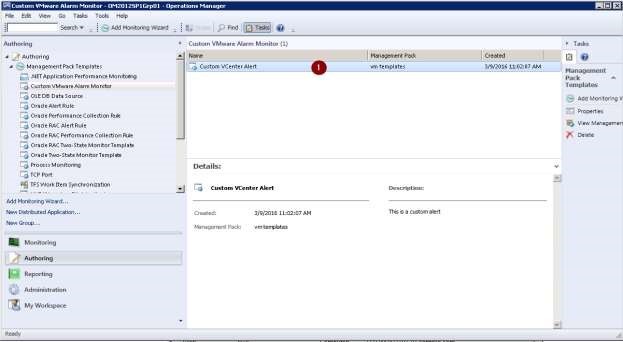
By clicking on the custom template, you can see the details entered using the custom wizard.
Now you can monitor the VMware alarm.
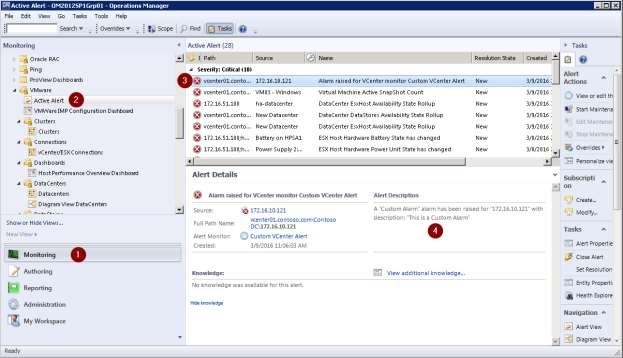
- Click on the “Monitoring” tab in the bottom left panel
- Under the Opslogix folder and then VMware, click on the “Active Alert” view
- If the alarm has been triggered, it will appear in the “Active Alert” form
- If you click on the alarm, it will show the “Alert Details” form with all the default details regarding the custom alarm.
Now you can access the Health Explorer:
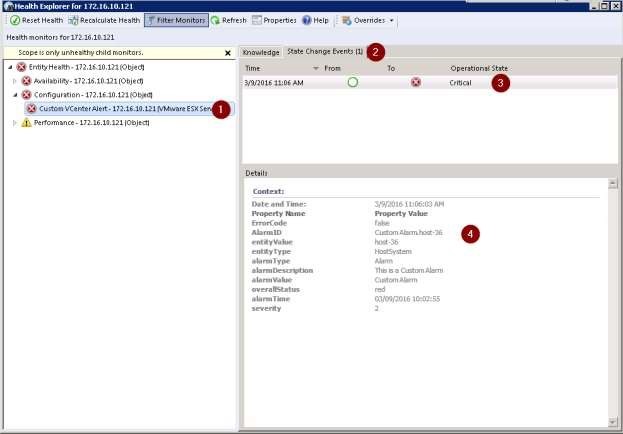
- You can locate the monitor under the chosen category that was set during the custom monitor section in the wizard template (see previous pages)
- Once selected, you can then click on the “State Change Events” tab in the right panel
- Since the alarm was raised the state has changed to “Critical”
- Select the event you are interested in. This will then show the “Details” of the event below