
Applies to: OpsLogix Capacity trending reports 1.0.13 and later · SCOM 2019, 2022, 2025
Last updated: October 2026 · Reading time: 5 minutes
The Capacity profile report forecasts a ready-made set of counters, such as disks, memory and processor, for every member of one or more SCOM groups. Each counter in a profile has its own direction, daily value and threshold, so you can review a server group in one run instead of running a report per counter.
Run the report
- In the Reporting workspace, open Capacity profile.
- Under Objects, use Add Group or Add Object to choose the groups or servers. Group members are included automatically.
- Choose the Capacity profile. The list shows how many counters each profile has.
- Set From (default 90 days back), the Warning and Critical days and Plan capacity for, and run the report.
You get one row per server, instance (for example each disk) and profile counter, the soonest to reach its threshold first. Click a server name to show its chart; click any other cell to open the Capacity overview for that counter, filtered to that server. For how to read the rows, see Reading the capacity forecast.
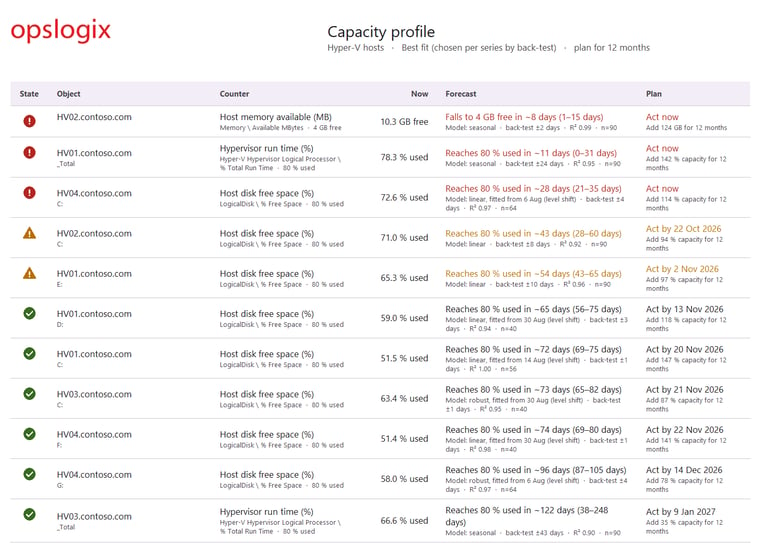
The Hyper-V hosts profile: host memory, host disks and hypervisor run time for every host in the group, each against its own threshold.
Shipped profiles
| Profile | Counters (threshold) |
| Windows server core | Disk free space (80 % used), memory available (1024 MB), memory committed (85 %), processor time (80 %, busiest hour) |
| Windows disks | Disk free space in % (80 % used) and in MB (10240 MB) |
| Memory | Memory available (1024 MB) and committed bytes in use (85 %, busiest hour) |
| Processor | Processor time (80 %, busiest hour) |
| SQL database files | Database free space in % (80 % used) and in MB (1024 MB), log free space (80 % used, daily maximum), from the SQL Server management packs |
| Hyper-V hosts | Hypervisor run time (80 %, busiest hour), host memory available (4096 MB), host disk free space (80 % used) |
A profile only shows counters that are collected in your management group. When several rules collect the same counter for a server, the one with the most data is used.
Add your own profile
Profiles are rows in the table dbo.OpsLogixCapacityReports_Profile in the SCOM data warehouse database. Add or change rows with SQL; you need write access to that table, for example as a member of db_owner. Management pack upgrades only add missing shipped rows and keep yours.
| Column | Meaning |
| ProfileName | The name shown in the Capacity profile list. Rows with the same name form one profile. |
| ItemName | The name of the counter within the profile, unique per profile. |
| ObjectName, CounterName | The performance object and counter, as LIKE patterns: % matches any text. To match a literal % sign, write !% (for example !% Free Space). |
| TypeReport | percentage or absolute |
| ReverseTrendDirection | 1 for free or available counters, where a falling value means filling up; otherwise 0 |
| PlanThreshold | % used for percentage items; the counter's own unit for absolute items |
| SampleType | DailyAverage, DailyPeakHour, Daily95thPercentile or DailyMaximum |
| SortOrder | The order of the items within the profile |
Example: a profile for file servers that keeps at least 50 GB and 15 % free on every disk.
INSERT INTO dbo.OpsLogixCapacityReports_Profile
  (ProfileName, ItemName, ObjectName, CounterName, TypeReport,
   ReverseTrendDirection, PlanThreshold, SampleType, SortOrder)
VALUES
  (N'File servers', N'Disk free space (%)', N'LogicalDisk', N'!% Free Space',
   'percentage', 1, 85, 'DailyAverage', 10),
  (N'File servers', N'Disk free space (MB)', N'LogicalDisk', N'Free Megabytes',
   'absolute', 1, 51200, 'DailyAverage', 20);
The new profile appears in the report the next time you open it. To remove it, delete its rows.