
Applies to: OpsLogix Capacity trending reports 1.0.13 and later · SCOM 2019, 2022, 2025
Last updated: October 2026 · Reading time: 5 minutes
The Capacity trending reports forecast when a performance counter, such as disk space, memory or CPU, reaches a threshold you set, based on the performance data in the SCOM data warehouse. You find them in the SCOM console in the Reporting workspace, in the folder OpsLogix.IMP.Capacity. Each report also has a knowledge article in the console that lists its parameters.
The reports
| Report | What it shows | Use it for |
| Capacity overview - Percentage value | Every server and instance for one percentage counter, soonest to reach the threshold first, with a chart per row and a Plan column (act-by date, capacity to add, what-if) | The starting point for capacity planning of disks, memory, CPU and other counters in percent |
| Capacity overview - Absolute value | The same for a counter in its own unit, such as Free Megabytes, shown in MB, GB or TB | Rules such as "keep at least 20 GB free" |
| Top N at risk - Percentage value / Absolute value | Only the N instances that reach the threshold first, worst first | A weekly e-mail subscription to the people who order or free up capacity |
| Capacity heat map - Percentage value / Absolute value | The days left until the threshold for every member of one or more groups, as a colour grid: one row per server, one column per instance | Seeing at a glance which servers of an application, site or team need attention |
| Capacity profile | A ready-made set of counters (for example Windows disks, memory and processor) for every member of one or more groups, each with its own threshold | A capacity review of a server group in one run |
| Percentage value Report - Multi instance | The forecast row and a full chart for each selected instance on the managed entities you pick | A printable per-server view, for example for a change or purchase request |
| Percentage value Report - Multi instance Group Selector | The same for the members of the groups you pick | A printable view of an application or site |
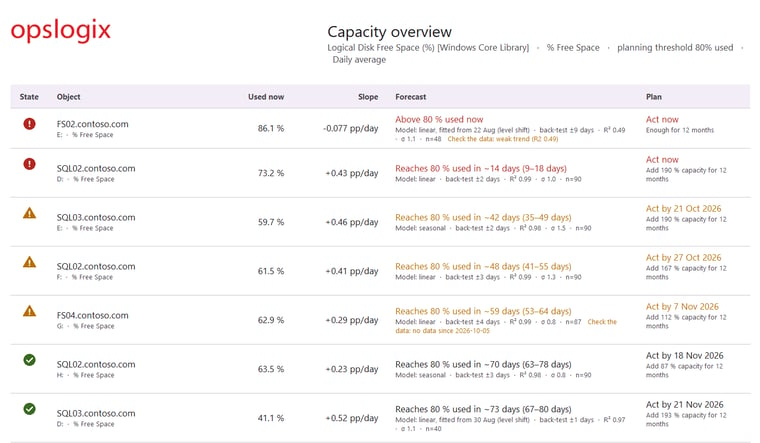
Capacity overview - Percentage value: the soonest to reach the threshold first, with the forecast and the Plan column on every row.
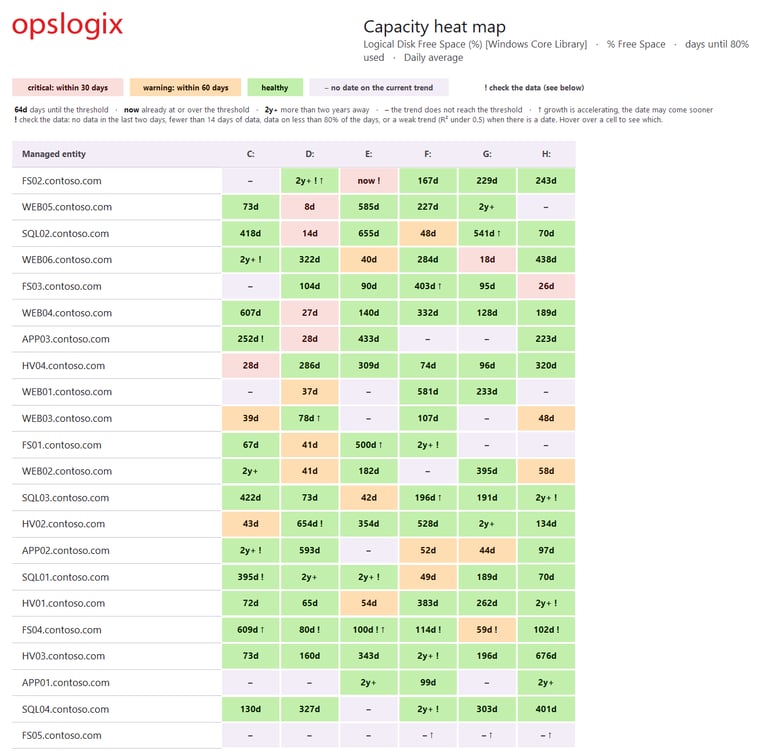
Capacity heat map - Percentage value: days until the threshold for every server and disk in a group.
Percentage or absolute value?
Use a Percentage value report for counters measured in percent, such as % Free Space or % Processor Time. Use an Absolute value report for counters in their own unit, such as Free Megabytes, Available MBytes or a queue length. After you pick a counter, the report tells you when the rule measures the other kind; switch reports in that case.
Parameters shared by the reports
- From: how much history the forecast learns from (default 90 days back). 60 to 120 days works well. To sets how far the chart looks ahead (default 90 days); the forecast date itself is not limited by it.
- Performance Rule, Counter and Object: choose the rule from the list (use Available Rule Languages and the filter boxes above each list to shorten them), then the counter and the performance object.
- Filter managed entities: optional text to include only servers whose name contains it. Separate several with commas, for example WEB01, SQL03.
- Planning threshold: the level at which you want to act, typically 80 or 85 % used rather than 100.
- Number of days for Warning and Critical Level: set Critical to the time it takes to order and install capacity (default 30 days) and Warning to when you want a heads-up (default 60).
- Sample Type, Forecast model, Plan capacity for and the What-if parameters: see Reading the capacity forecast.
- Expand charts: charts are collapsed until you click a server name; set this to Yes to open all of them for printing or PDF export.
Schedule the Top N report as an e-mail
- Open Top N at risk from the Reporting workspace and set the parameters you want.
- Choose Schedule in the Actions pane.
- Choose e-mail delivery, a weekly schedule and the PDF format.
E-mail delivery needs the SMTP settings of SQL Server Reporting Services.
Reports removed in earlier versions
Version 1.0.8.0 removed eight single-instance and critical-only reports and version 1.0.9.0 removed the absolute multi-instance reports. An upgrade deletes e-mail subscriptions, linked reports and favourites on them; recreate them on the replacement:
| Removed report | Use instead |
| Percentage value Report - Single instance | Percentage value Report - Multi instance (pick one instance) |
| Percentage value Report - Single instance Group Selector | Percentage value Report - Multi instance Group Selector |
| Percentage value Report - Single instance Critical Only | Top N at risk or Capacity overview |
| Percentage value Report - Single instance Critical Only Group Selector | Percentage value Report - Multi instance Group Selector |
| Percentage value Report - Multi instance Critical Only | Top N at risk |
| Percentage value Report - Multi instance Critical Only with Group Selector | Capacity heat map or Top N at risk |
| Absolute value Report - Single instance and Multi instance | Capacity overview - Absolute value |
| Absolute value Report - Single instance and Multi instance Group Selector | Capacity heat map - Absolute value |