
Applies to: OpsLogix Capacity trending reports 1.0.13 and later · SCOM 2019, 2022, 2025
Last updated: October 2026 · Reading time: 8 minutes
Every row in the capacity overview, top N, multi-instance and profile reports, and every cell in the heat map, is a forecast for one counter instance on one server. This article explains what the figures mean and which parameters change them.
How a forecast is made
- The report takes one value per day from the data warehouse, for the period between From and today. Sample Type chooses that value: Daily average (default) for steady growth such as disks; Busiest hour of each day, 95th percentile of each day or Daily maximum when peaks matter, such as CPU or memory.
- It looks for a level shift: a step change such as a cleanup, a migration or an added disk. If it finds one, it only uses the days after it, and the forecast says fitted from <date> (level shift).
- It fits the forecast model and calculates when the trend crosses the Planning threshold, with a 95% range.
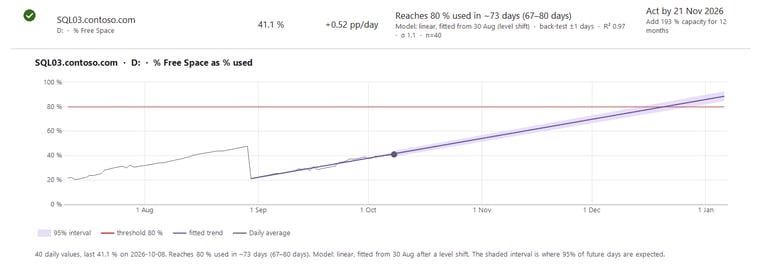
A row with its chart opened: the disk was cleaned up at the end of August, so the trend is fitted from the level shift on 30 Aug and reaches 80 % used in about 70 days.
Reading a row
| Item | Meaning |
| State | Red: the threshold is reached within the Critical days, or already. Amber: within the Warning days. Green: later, or not on the current trend. |
| Now | The last daily value. Percentage counters that measure free space, such as % Free Space, are shown as % used, so every value reads the same way as the threshold. |
| Forecast | For example Reaches 80 % used in ~39 days (33–45 days), or Falls to 20.0 GB in ~65 days for a free-space counter. The days in brackets are where the 95% range of the forecast crosses the threshold; a wide range means the date is uncertain. |
| Model and back-test | The model used, and how many days off it was when it forecast the last weeks from the weeks before. |
| R² | How well the trend fits: close to 1 is a steady trend, under 0.5 is weak. |
| σ and n | The typical day-to-day scatter around the trend, and the number of days with data. |
| Check the data | Stale data (nothing in the last two days), fewer than 14 days, gaps, or a weak trend. With fewer than 14 days no date is given. In the heat map this is the ! symbol. |
| Growth is accelerating | A curve fits clearly better than a straight line, so the threshold may be reached sooner than the date shown. In the heat map this is the ↑ symbol. |
| Forecast failed: … | The forecast could not be calculated; the text gives the reason. See Capacity reports show rsErrorExecutingCommand or "Forecast failed". |
Forecast models
Leave Forecast model on Best fit unless you have a reason to choose one.
| Model | How it works | Good for |
| Best fit (default) | Tries the models below on the last weeks of history and keeps the most accurate one for each series | Most counters |
| Straight line | A least squares line through the data | Steady growth without outliers |
| Robust line | The median of all slopes, so a few unusual days cannot tilt it | Series with occasional spikes or dips |
| Weekly pattern (Holt-Winters) | A trend plus a repeating weekday shape | Counters with a working-week rhythm, such as CPU or memory |
| Busy days (95th percentile) | The line that 95% of the days stay below | When the busy days, not the average, must stay under the threshold |
The Plan column
- Act by: the date the forecast reaches the threshold, minus the Critical days. Set Number of days for Critical Level to the time it takes to order and install capacity. Act now means that date has passed; the row is then red. No action needed means the trend does not reach the threshold.
- Add: the capacity that keeps the series under the threshold for the Plan capacity for period (6, 12 or 24 months). Percentage reports show it as a share of today's size: Add 25 % capacity for 12 months on a 400 GB disk means about 100 GB more. Absolute reports show it in the counter's unit, for example Add 120 GB for 12 months. It uses the trend plus two standard errors, so busy days stay under the threshold too. Enough for 12 months means nothing needs to be added.
- What-if: shown when you set What-if: growth factor (2 means growth doubles, 0.5 that it halves) or What-if: capacity added (a percentage of today's size, or the counter's unit in absolute reports). It shows when the threshold is reached in that scenario; the report title lists the scenario. Leave them at 1 and 0 for no scenario.
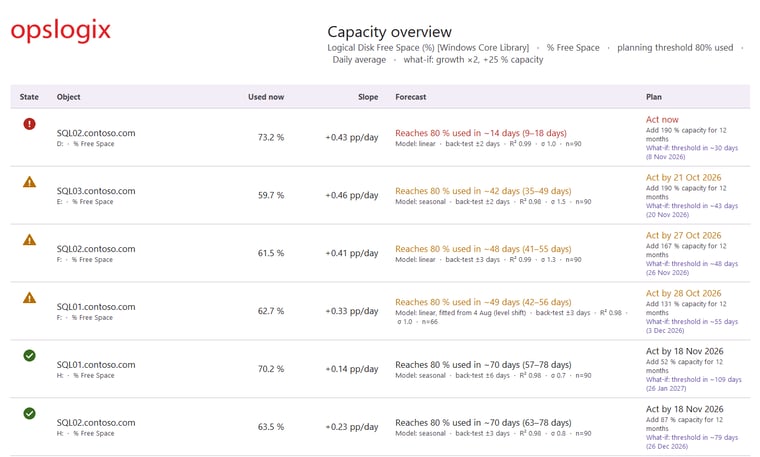
The Plan column with a what-if scenario (growth doubles, 25 % capacity added): the act-by date, the capacity to add for 12 months and the threshold date in the scenario.
Free-space counters
Reverse forecast direction is switched on automatically when the counter name contains Free or Available, so a falling value is read as filling up. Change it only for other counters that measure free capacity. In percentage reports the threshold is still entered as % used; in absolute reports it is the minimum to keep free, in the counter's unit (for a Free Megabytes counter, 20480 means 20 GB).
Tips
- Use 60 to 120 days of history: shorter reacts faster to change, longer is steadier.
- A wide date range, a low R² or a large back-test error means the date is uncertain; look at the chart before you act on it.
- Hover over any value in the reports for an explanation.