■ Management Packs for Operations Manager and Azure Solutions
■ Automation and integration products for Operations Manager
■ Plan, measure and follow up on KPIs of your IT Service delivery
■ Managed SCOM Service
■ World-class consulting services for SCOM
■ Find DevOps Engineers for your next project
Integrate your System Center Operations Manager (SCOM) data with Grafana, using this native data source.
Access SCOM’s rich dataset through Grafana's intuitive dashboards.
Execute comprehensive operational data queries directly through the SCOM API.
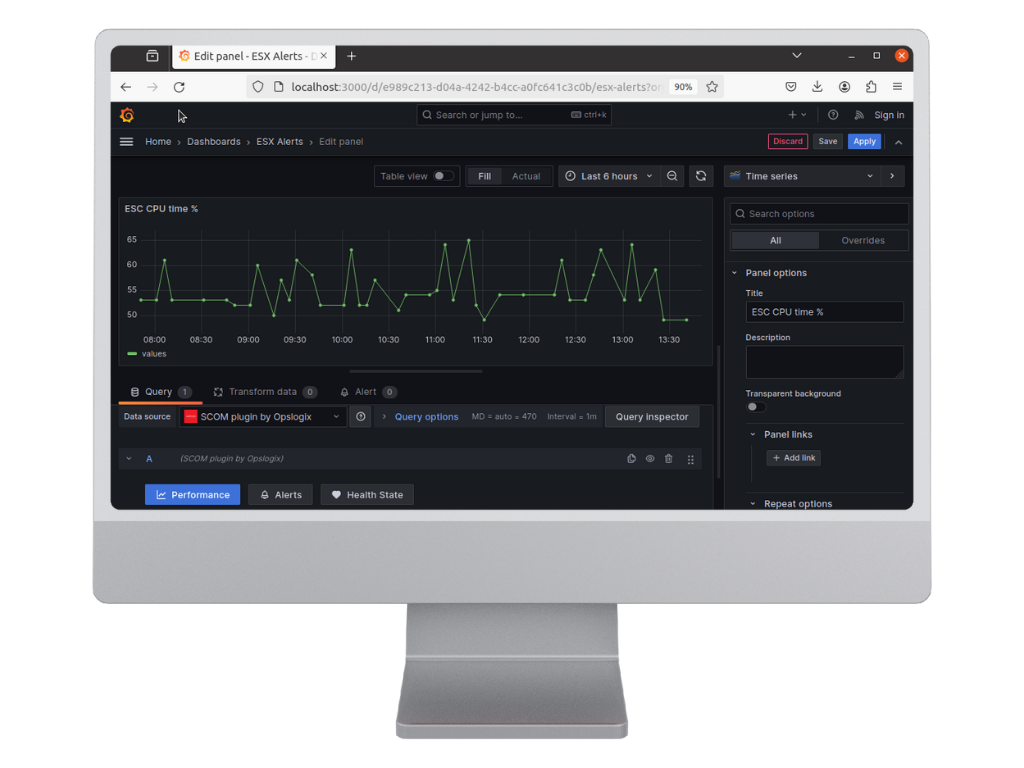
Gain real-time insights, visualize critical performance metrics, and monitor system health effectively.
Ideal for system administrators and IT operations teams, this data source offers enhanced monitoring capabilities and flexible, data-driven decision-making within your infrastructure.
Seamlessly connect Grafana to SCOM using a native datasource, ensuring smooth operational data queries through the SCOM API.
Visualize and track performance metrics, alerts, and system health data from SCOM in real-time, all within Grafana.
Build customizable Grafana dashboards that showcase critical operational data, helping you keep track of system health and performance.
Access historical operational data from SCOM for trend analysis, allowing you to make data-driven decisions based on past performance.
Set up alerting and notifications in Grafana based on key metrics sourced from SCOM, so your team stays proactive with system monitoring.
Execute flexible queries to access the specific operational data you need, allowing deep insights into the performance and status of your IT infrastructure.
Ensure you have Grafana version 7.0 or higher installed. You can download the latest version from Grafana's official site.
The SCOM Datasource is a native integration that connects Grafana to System Center Operations Manager (SCOM), allowing you to query operational data through the SCOM API and visualize it within Grafana dashboards.
This datasource works with Grafana version 7.0 or higher. Make sure your Grafana installation is updated for full compatibility.
The amount of data you can query is only limited by your SCOM instance’s capabilities. However, performance may vary depending on your infrastructure and the volume of data being processed.
Yes, you can query both standard and custom metrics from your SCOM instance, offering flexibility in the data you wish to visualize.
Absolutely. Grafana’s alerting system can be configured to trigger alerts based on specific metrics and thresholds from your SCOM data.
Yes, this integration uses secure APIs to connect SCOM with Grafana, ensuring your data is safe. You can configure authentication settings to match your organization’s security policies.
Starting with new solutions can be challenging, and knowing where to begin is often the hardest part.
That is why we are now offering 10 free hours of consultation to help you get started with the Grafana LGTM Stack according to best practices.
Click the link below to begin your Grafana LGTM Stack journey today!
Get a complete view of your system’s health by consolidating SCOM’s operational data within Grafana’s intuitive dashboards.
Use real-time and historical data to make smarter, data-driven decisions about your IT infrastructure and system performance.
Reduce downtime and improve service availability with proactive alerting and monitoring of critical infrastructure metrics.
Centralize all your monitoring efforts in Grafana, simplifying the complexity of managing multiple tools and improving team collaboration.
By optimizing your system performance and minimizing downtime, this integration helps reduce operational costs and increases overall efficiency.
Tailor Grafana’s dashboards to meet your specific business needs, enabling teams to focus on the most relevant metrics and data for optimized performance monitoring.
Edit this rich-text to provide the visitor with all appropriate information. You might add images, calls-to-action, horizontal rules, videos, quotes, etc. All this and more can be done through the text editor.
IJburglaan 630H
1087 CE Amsterdam
The Netherlands
Call us: +31 20 893 2048
VAT NL820308195B01
Office hours are
CET (Central European Time)