Opslogix Oracle Management Pack - Oracle functional monitoring
by Michel Kamp, on Oct 30, 2020 10:57:50 AM

All databases provide a place to run applications. Monitoring an infrastructure is usually based on its technical components which goes on to extrapolate the health of its applications and programs. However, wouldn’t it be more efficient to monitor the application’s functionality itself?
So imagine you have an Order application that consists of a Web UI frontend, Web API backend, business service and an Oracle Database.
When the user enters an order using the Web UI it will be passed through to the Web API backend and stored in the Order table on the Oracle database.
Parallel to this we have the corresponding business service that consumes the data from the Order table which contains the Order information.

So the question in this case would be, how can we be sure that this application’s dataflow is still 100% healthy?
We already have information on its technical KPI’s, i.e. the website server is still up, the business service is running and it looks like there is enough Oracle table free space.
Everything seems fine, but Backend Services informs us that they are receiving no orders.
This is where functional monitoring can speedily resolve business critical services.
Using functional monitoring, we can further dissect the data sets to look at:
- Are there over 10 order records still pending in the table?
- Does 0 order records reflect on the frontend being down?
- What are the total number of current pending orders and what kind of trend does a 30 day order process look like and does this corroborate with available (hardware and software) system resources?
Functional monitoring
In the OpsLogix Oracle Management Pack we have implemented 4 Authoring templates that you can use to answer the functional monitoring KPI's. In the below templates you can use a custom Oracle TSQL query. This query may only output 1 row with multiple columns. The value from one of the columns can be used to trigger a monitor state and generate an alert.
- Oracle Two-state monitor template
When the result of an Oracle query is hitting 2 types of thresholds the monitor will go in a state and a alert will be generated
- Oracle Three-state monitor template
When the result of an Oracle query is hitting 3 types of thresholds the monitor will go in a state and a alert will be generated
- Oracle Alert rule template
When the results of an Oracle query is hitting 1 type of threshold a alert will be generated or the repeated count will be raised.
- Oracle Performance collection rule template
The Oracle Query result will be used to store data into the Operations Manager DB or data warehouse for dashboarding or reporting.
For this order application scenario we are going to use the templates described below:
KPI: When there are more than 10 order records in the order table the business service could be down.
We use the "ORACLE two-state monitor template" to add the query 'select count(*) "Order_COUNT" from orders' with a interval of 60 seconds and thresholds :
Critical when column value Order_COUNT > 10
Healthy when column value Order_COUNT <= 10
KPI: When there are 0 order records the frontend UI could be down.
We use the "ORACLE two-state monitor template" to add the query 'select count(*) "Order_COUNT" from orders' with interval of 60 seconds and thresholds:
Information when column value Order_COUNT = 0
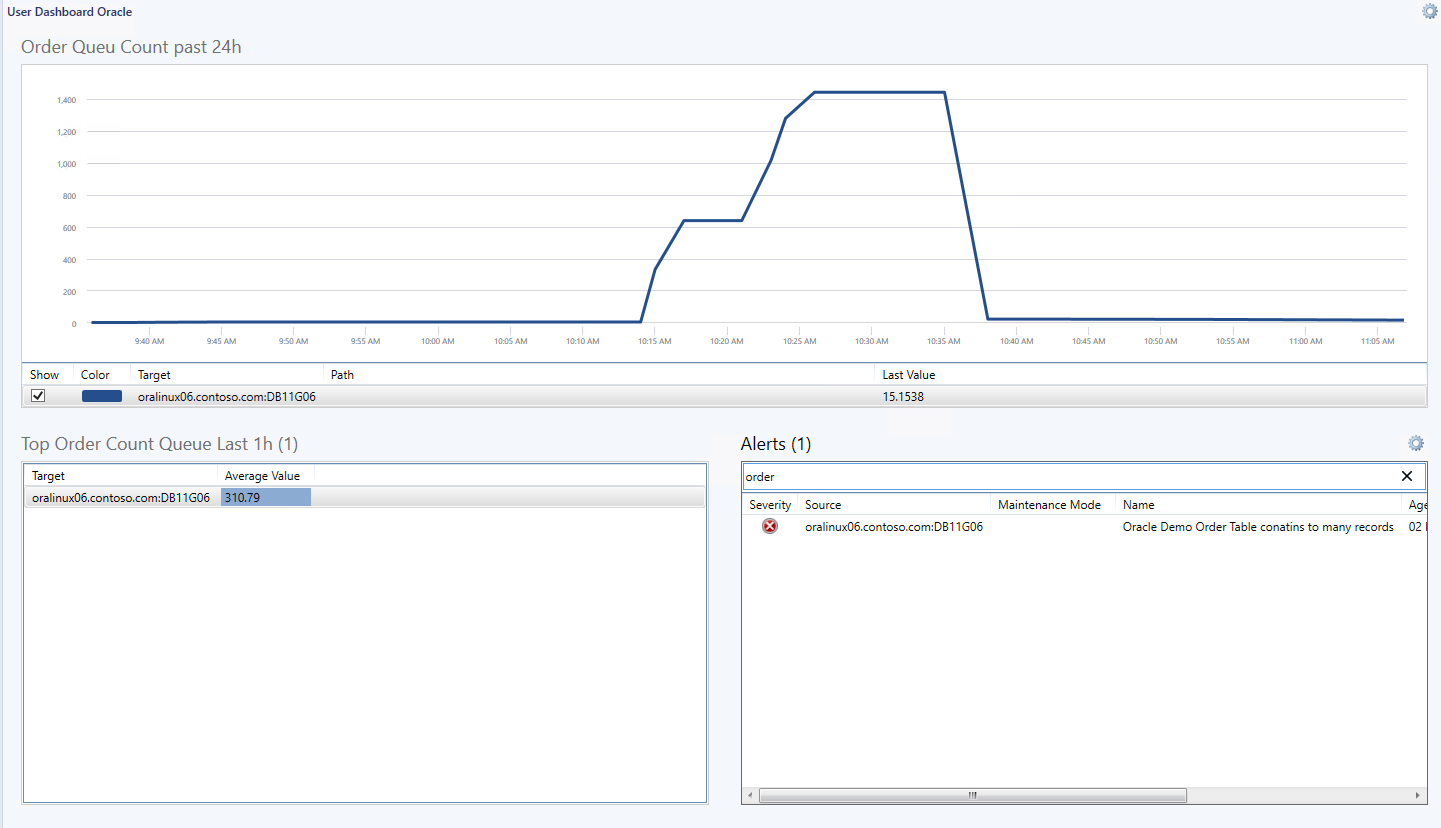
KPI:Need to display on a dashboard the current pending orders and management wants a report on 4 weeks order processing trend.
For this requirement we use the "Oracle performance collection rule template" with the query 'select count(*) "Order_COUNT" from orders' with a interval of 60 seconds.
After we have applied the templates the end results will be as below:

For more details on how to use the Oracle Authoring templates please continue to this knowledge base article "Oracle Management Pack Templates User Guide"
Thanks,
Michel Kamp


